Interactive
Mapper Instructions
![]()
The interactive mapper is a product of greenspace analysis conducted by the Center for Geographic Information Systems at Georgia Tech for Trees Atlanta. The interactive mapper allows users to see the potential greenspace areas in the City of Atlanta that have been identified, mapped and prioritized for acquisition. Once the interactive mapper program is started, users will see the following graphic (figure 1.) on the home page. Figure 1 represents potential greenspace (green) in Atlanta as identified by the GIS Center.
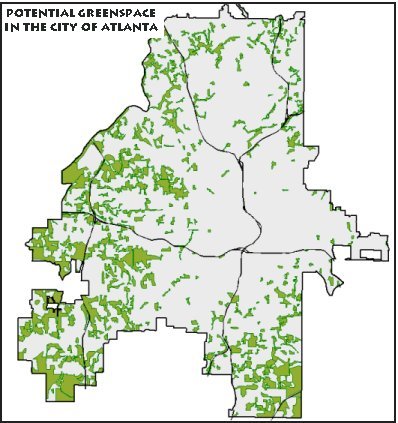
Figure 1.
Clicking on the graphic will take users to the starting point for the mapper (figure 2.)
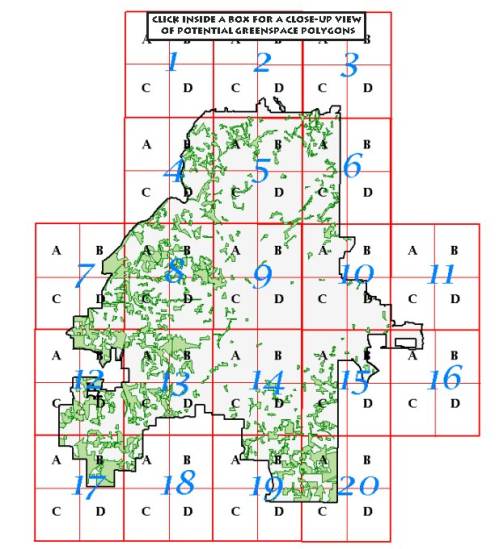
Figure 2. Mapper Starting
Point
Figure 2 is a map of Atlanta broken down into quadrants (blue numbers) and quarter quadrants (black letters). Clicking on a quarter quadrant (black letter) will provide the user with a zoomed in view of that area. The zoomed in view will pop up in a new window. Figure 3 is the result of clicking on the 4b quarter quadrant.
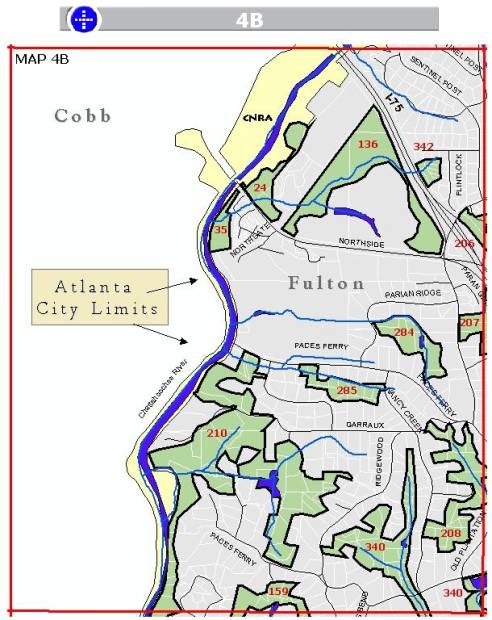
Figure 3. Quarter quadrant
4b
This map shows the potential greenspace polygons (green), parks (yellow), parcel boundaries (white), roads (black) and streams and lakes (blue). The red numbers inside the potential greenspace polygons represent their identification numbers. Clicking on an id will bring up attribute information taken from the greenspace analyses results table for that potential greenspace polygon (figure 4.) The example below is for polygon 136. After clicking on 136, all information pertaining to polygon 136 is displayed to the right of the image. All analyses scores can be viewed.
Figure 4. Attribute info for
polygon 136
The column definitions for the attribute information are:
- Greenspace ID = Unique identifier for a greenspace polygon.
- Mapper Code = This number list the quadrant on the Greenspace Interactive Mapper where the greenspace polygon is located
- Acres = Acreage of the greenspace polygon
- Connectivity 1 = Results of first connectivity analysis. See the ranking criteria for scoring explanations. Scores range from 1 as the highest priority and 4 as the lowest.
- Connectivity 2 = Results of second connectivity analysis. See the ranking criteria for scoring explanations. Scores range from 1 as the highest priority and 4 as the lowest.
- Connectivity Total = Cumulative connectivity analyses scores
- Forest 1 = Results of first forestry analysis. See the ranking criteria for scoring explanations. Scores range from 1 as the highest priority and 4 as the lowest.
- Forest 2 = Results of second forestry analysis. See the ranking criteria for scoring explanations. Scores range from 1 as the highest priority and 4 as the lowest.
- Percent Forest Cover = Percent forest cover for potential greenspace polygon
- Forestry Total = Cumulative forestry analyses scores.
- Water 1 = Results of first water quality analysis. See the ranking criteria for scoring explanations. Scores range from 1 as the highest priority and 4 as the lowest.
- Water 2 = Results of second water quality analysis. See the ranking criteria for scoring explanations Scores range from 1 as the highest priority and 4 as the lowest.
- Water Total = Cumulative water quality analyses scores.
- Final prioritization score (Total for all analyses) = Cumulative scores form all three analyses (Water total + Forest Total + Connectivity Total)
- Remarks = Comments regarding potential greenspace polygon
- NPU = The City of Atlanta Neighborhood Planning Unit where the potential greenspace polygon is located
- Council District = The City of Atlanta council district where the potential
The id numbers for each polygon can
also be cross referenced with to the
greenspace acquisition support documents, which contain the results of all
greenspace analyses, as well as tax and property information for each
potential greenspace area (polygon).
The scoring criteria and analysis results can be found in the final report or on the reference page of the Interactive Mapper.
The interactive mapper is designed for users who are not familiar with or do not own GIS software. If you have any questions or comments regarding the interactive mapper, please contact:
Tony Giarrusso
The Center for GIS, Georgia Institute of Technology
404-894-0127