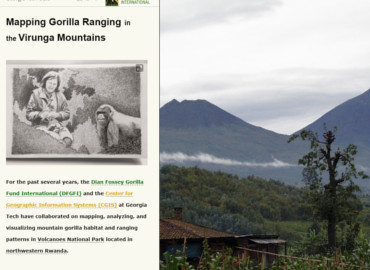
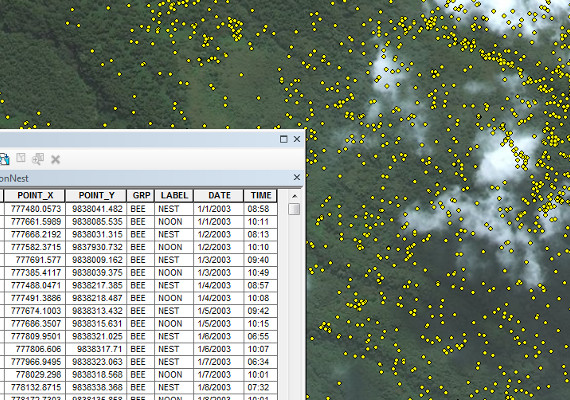
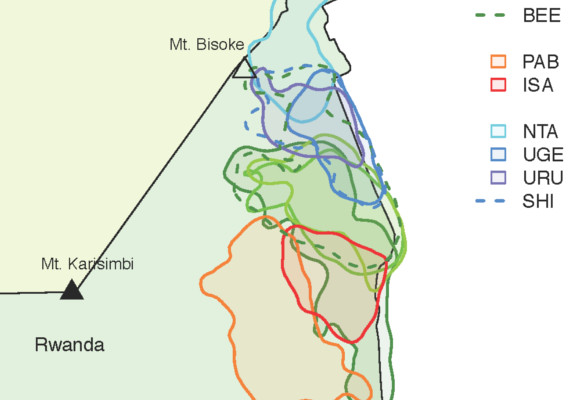
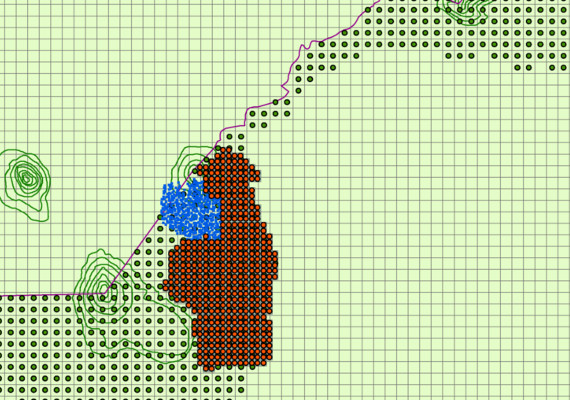
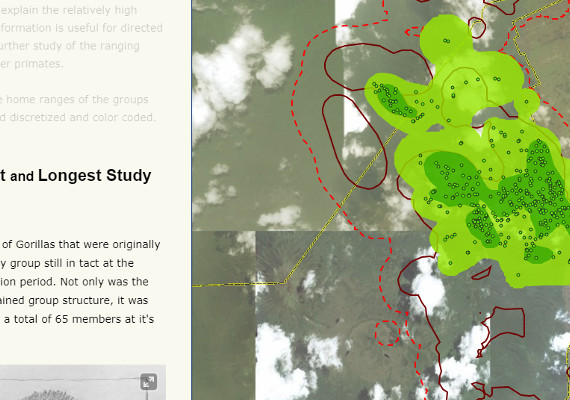
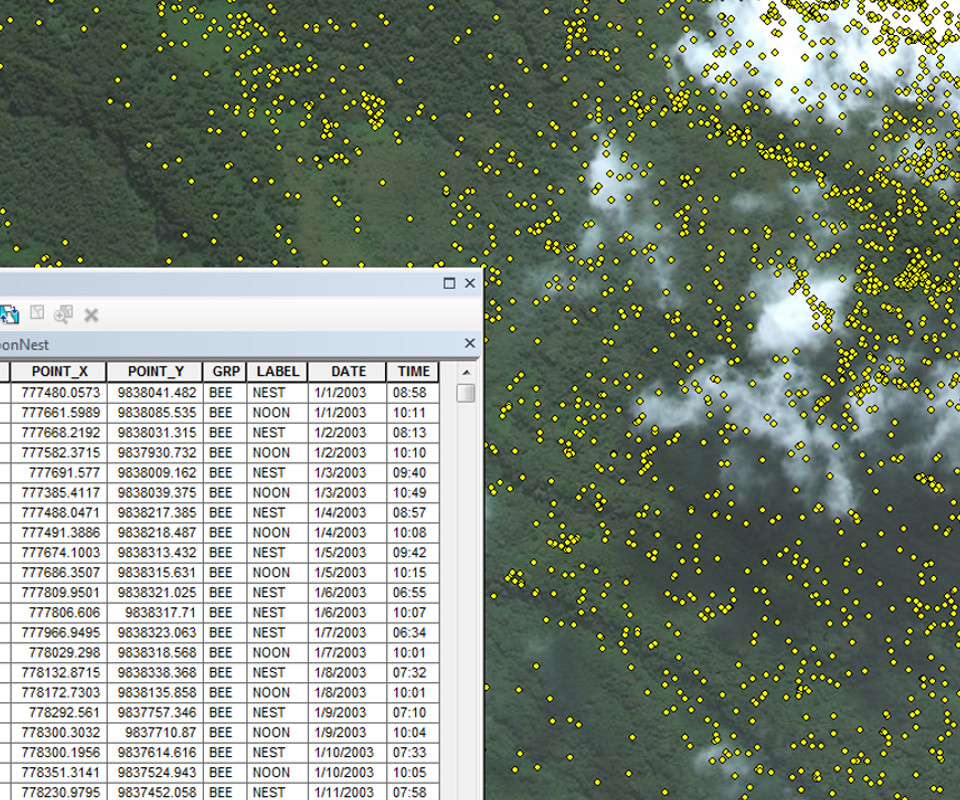
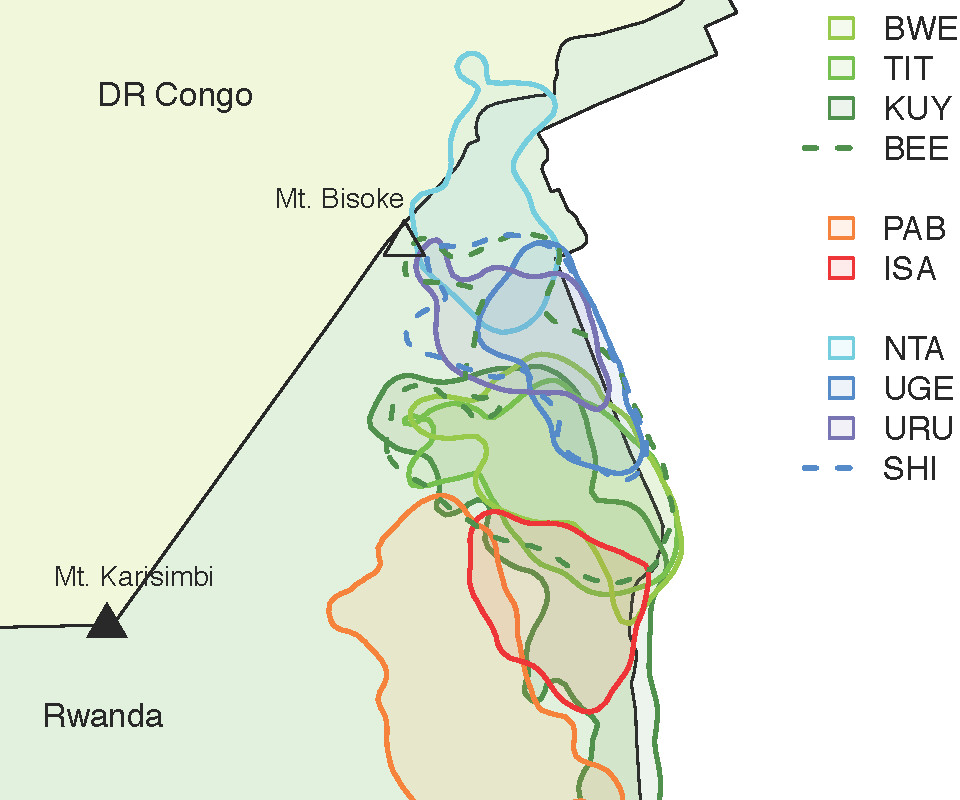
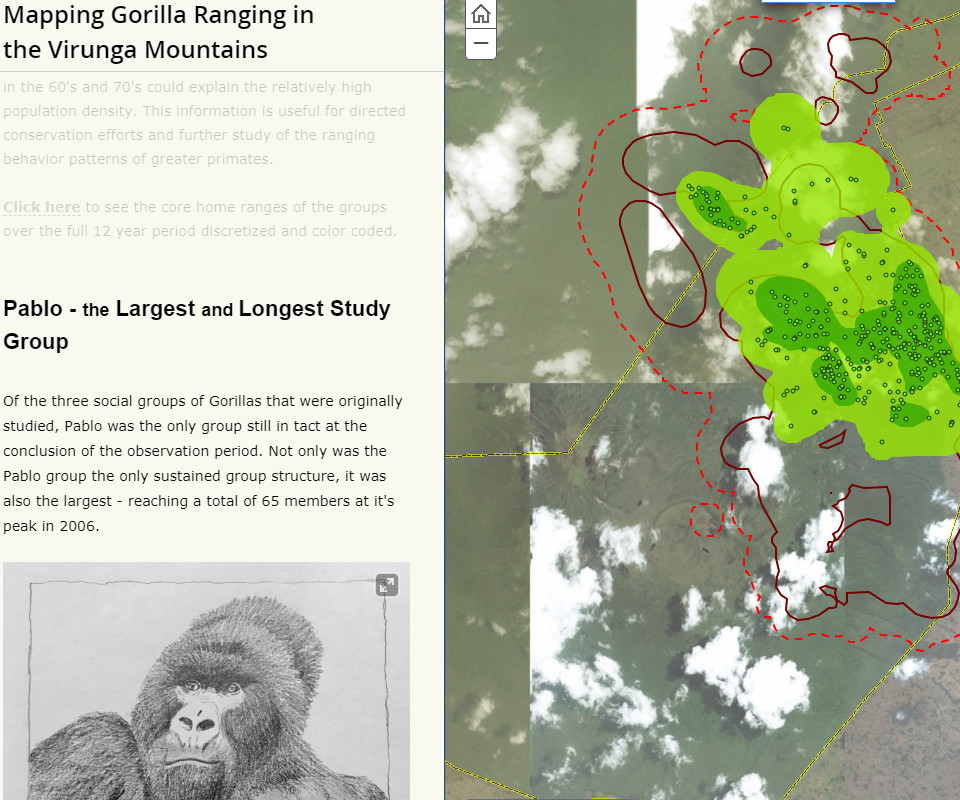
This Story Map provides some background on Dian Fossey and the Gorilla Fund she established to promote conservation efforts for endangered mountain gorillas. With background on past data collection and analysis methods, gorilla group family dynamics, and the Kernel Density Estimation used to establish home ranges, this map is a great introduction into the work completed by Georgia Tech and the Dian Fossey Gorilla Fund.
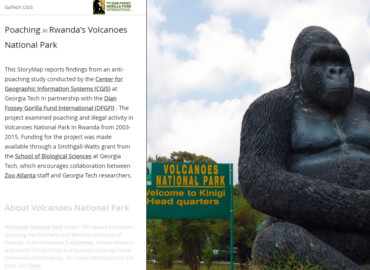
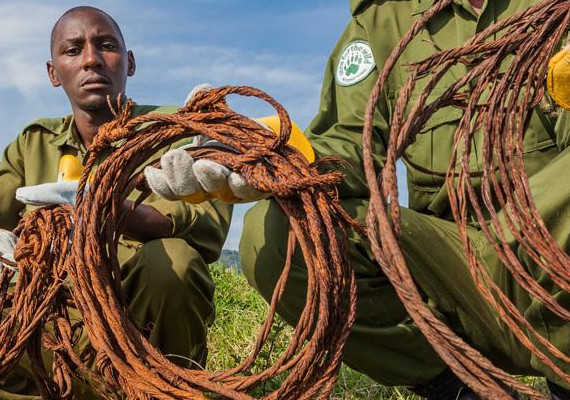
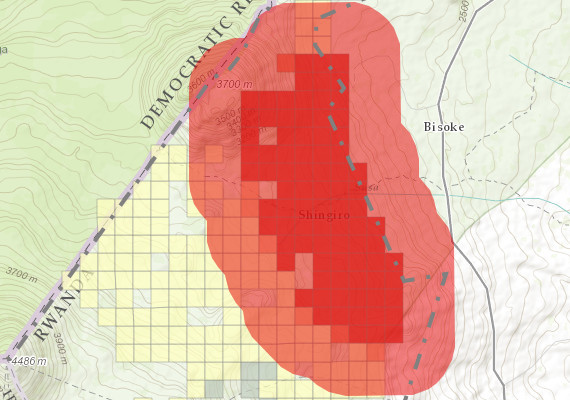
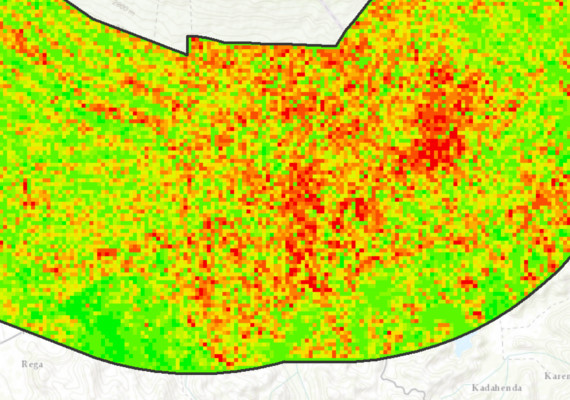
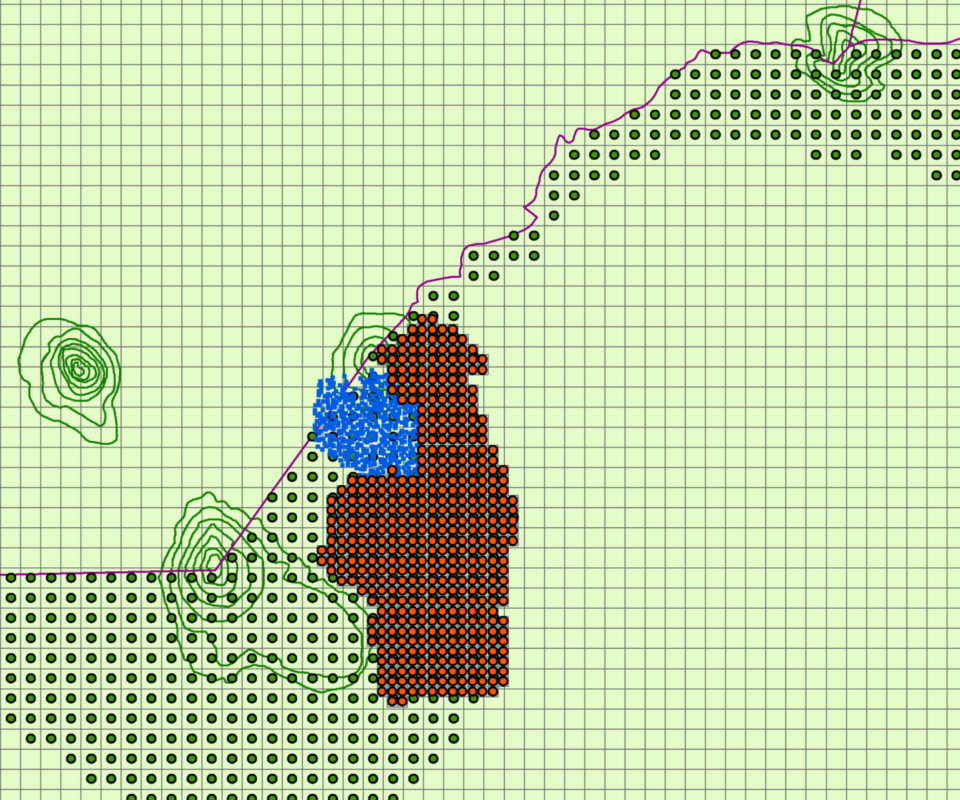
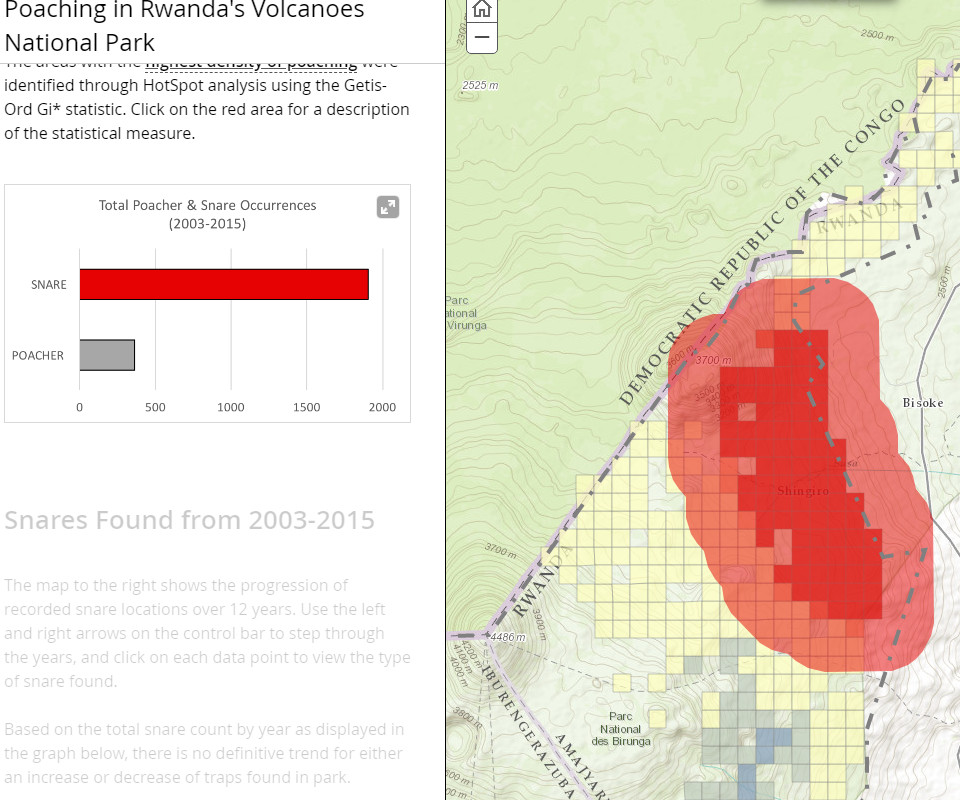
This map application covers the background and type of poaching that affects the endangered mountain gorillas in the Virungas mountains. Data collected by anti-poaching teams is presented by category and type, with hotspot analysis results showing the areas most likely to be negatively affected by human activity inside the park.
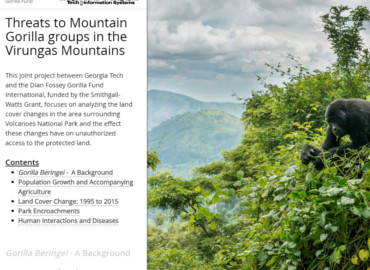
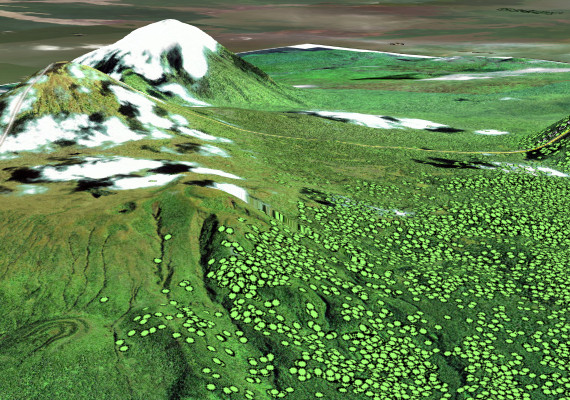
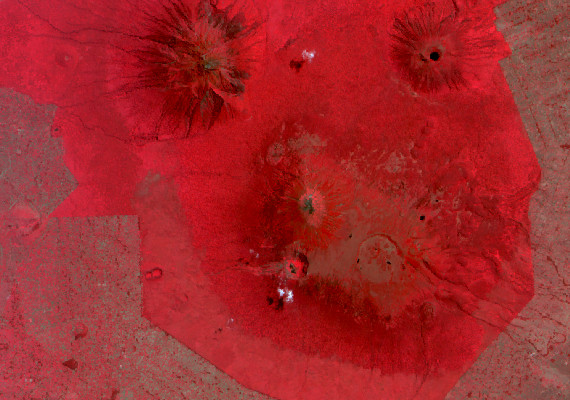
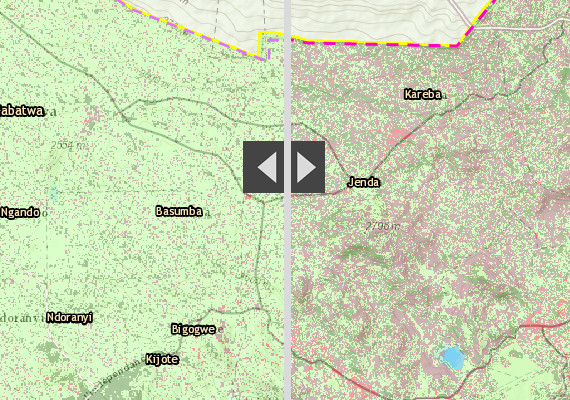
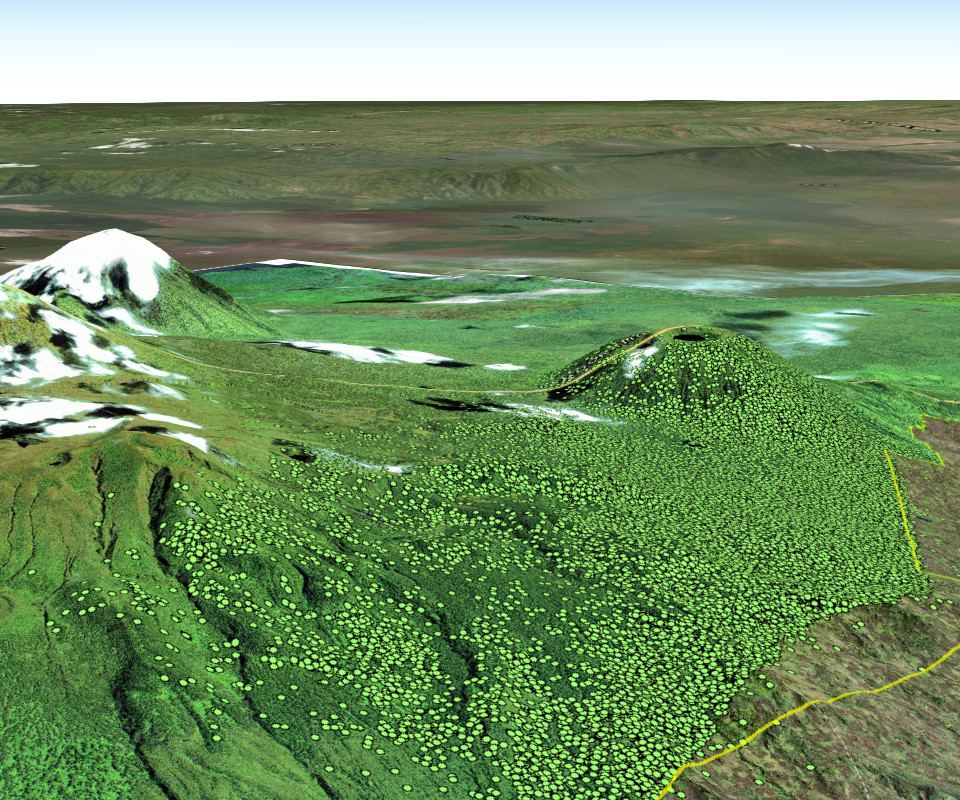
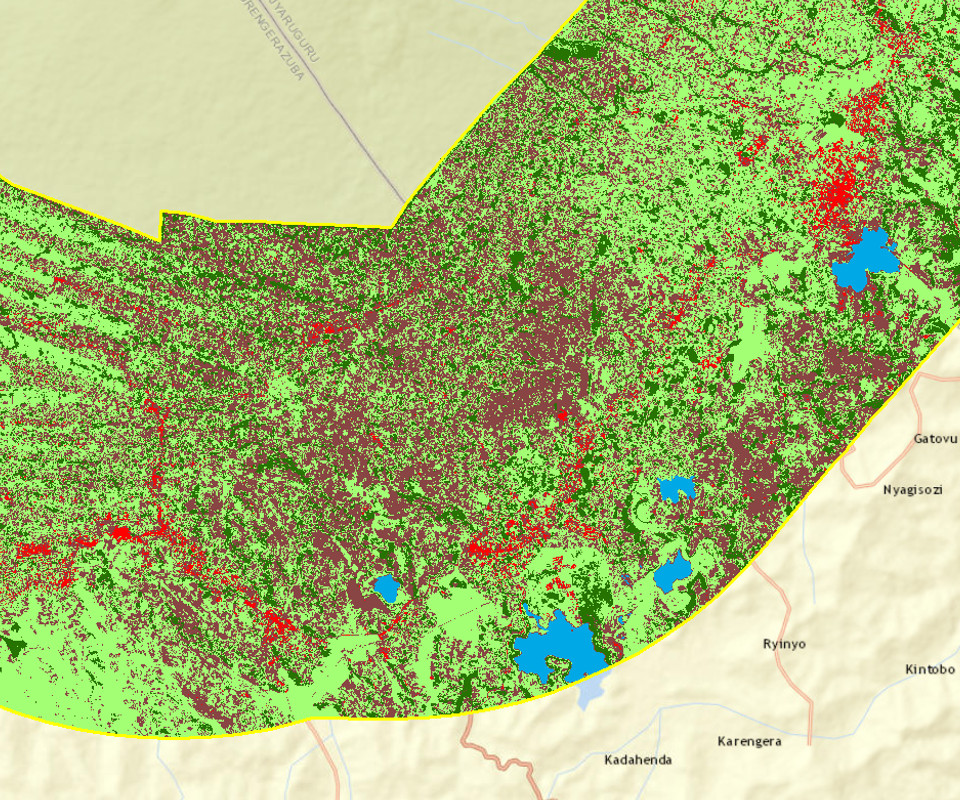
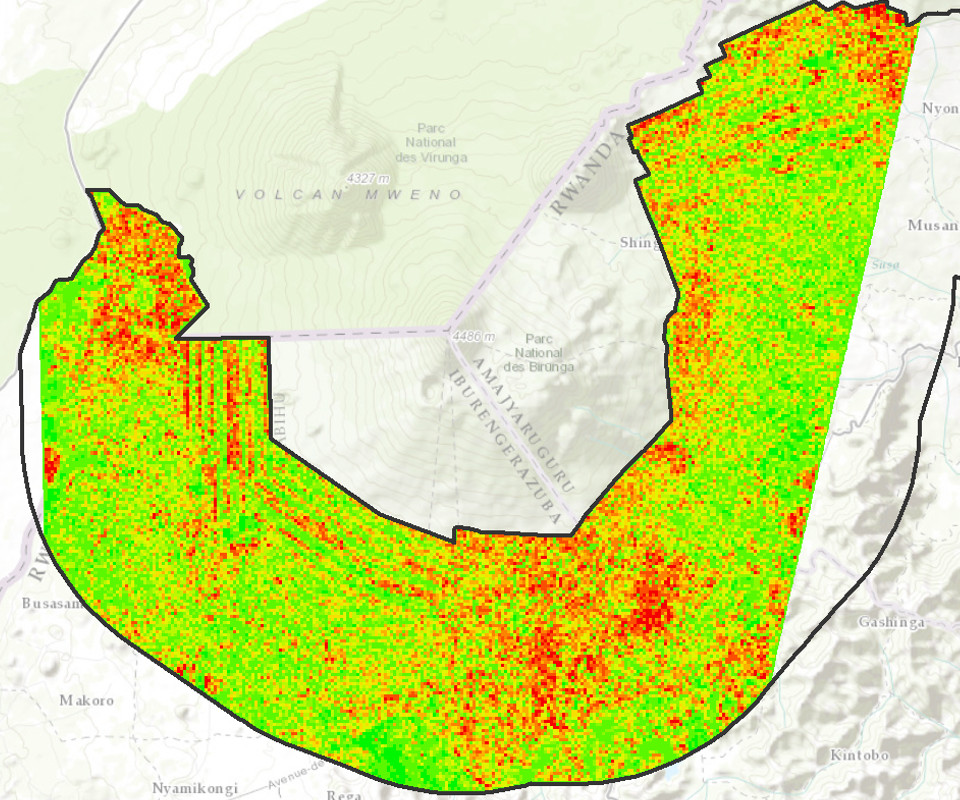
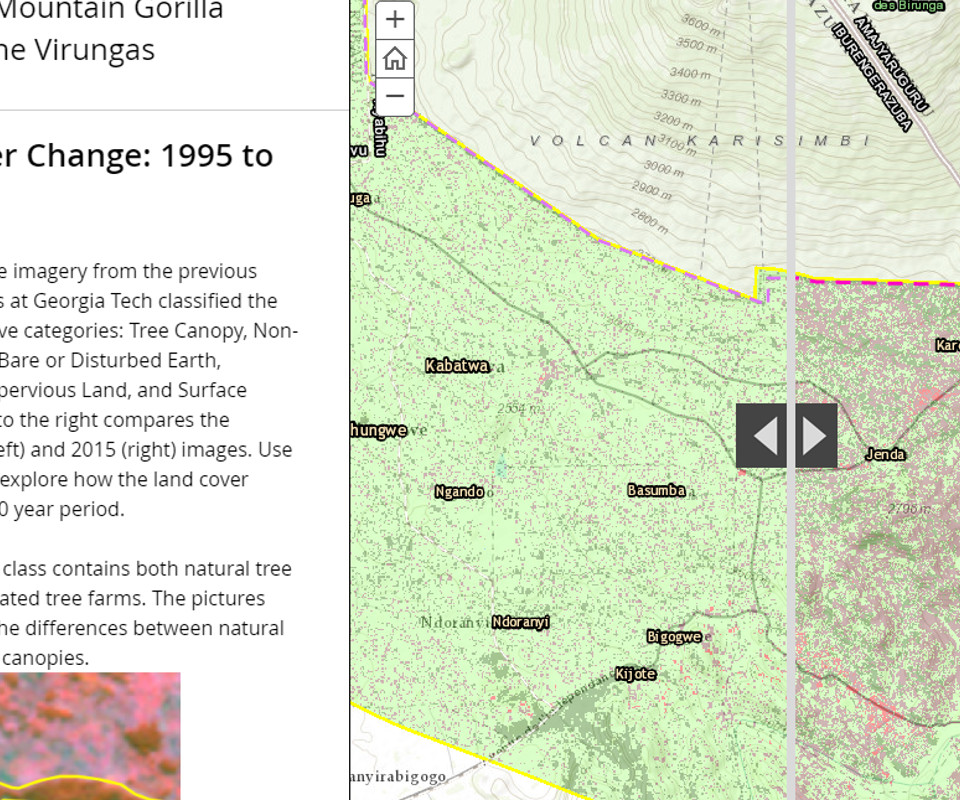
The data presented in the appliaction covers the past two decades of population growth, increasing agriculture, and landcover change in the vicinity of the Karisoke Research Center. Information about the classification of satellite imagery into land cover classes and the comparison of these classes over a twenty year study period accompanies data-swipe maps and illustrative examples.
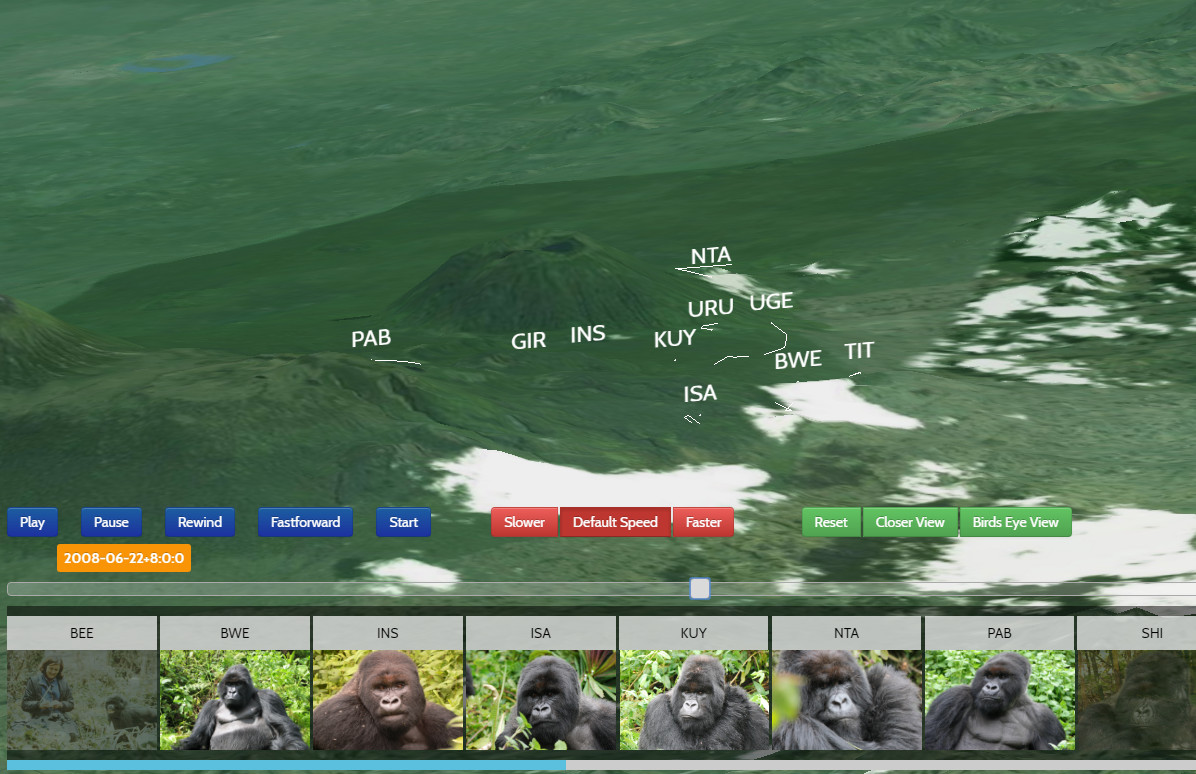
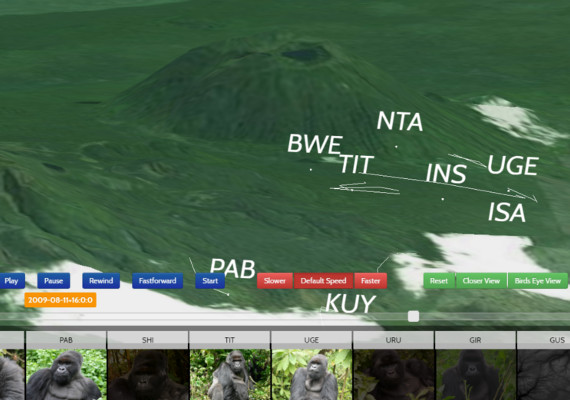
One of the uses of the gorilla tracking point data is the visualization of individual group movements over time. In this web based data viewer, each Gorilla home group is represented as a point on the map with the group's short title above it. As the app steps through the years, the emergence of new groups can be seen as the original Gorilla groups either fracture or change leadership.
Controls are available to step forwards and backwards through the data, change the playback speed, highlight groups, and change the viewing angle. Give the application a minute to load, please.